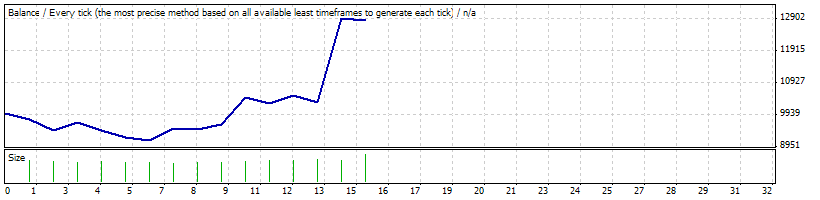
Strategy Tester Report
AlpariUK-Demo (Build 225)
| Symbol | USDJPY (US Dollar vs Japanese Yen) | ||||
| Period | 1 Hour (H1) 2009.11.03 02:00 - 2009.11.27 22:00 (2009.11.01 - 2009.11.30) | ||||
| Model | Every tick (the most precise method based on all available least timeframes) | ||||
| Parameters | Autor=""Rafael"; Desc1=""If"; Desc2=""alertpay"; Desc3=""Thanks"; Lots=0.01; ADX=25; NumeroMagico=100; | ||||
| Bars in test | 551 | Ticks modelled | 541880 | Modelling quality | n/a |
| Mismatched charts errors | 113 | ||||
| Initial deposit | 10000.00 | ||||
| Total net profit | 2855.20 | Gross profit | 4438.61 | Gross loss | -1583.41 |
| Profit factor | 2.80 | Expected payoff | 190.35 | ||
| Absolute drawdown | 897.17 | Maximal drawdown | 2508.98 (16.46%) | Relative drawdown | 16.46% (2508.98) |
| Total trades | 15 | Short positions (won %) | 11 (36.36%) | Long positions (won %) | 4 (50.00%) |
| Profit trades (% of total) | 6 (40.00%) | Loss trades (% of total) | 9 (60.00%) | ||
| Largest | profit trade | 2590.44 | loss trade | -327.11 | |
| Average | profit trade | 739.77 | loss trade | -175.93 | |
| Maximum | consecutive wins (profit in money) | 2 (982.89) | consecutive losses (loss in money) | 3 (-559.91) | |
| Maximal | consecutive profit (count of wins) | 2590.44 (1) | consecutive loss (count of losses) | -559.91 (3) | |
| Average | consecutive wins | 1 | consecutive losses | 2 | |
| # | Time | Type | Order | Size | Price | S / L | T / P | Profit | Balance |
| 1 | 2009.11.03 04:27 | sell | 1 | 1.00 | 90.247 | 0.000 | 0.000 | ||
| 2 | 2009.11.03 15:52 | close | 1 | 1.00 | 90.431 | 0.000 | 0.000 | -203.47 | 9796.53 |
| 3 | 2009.11.04 00:58 | buy | 2 | 0.97 | 90.450 | 0.000 | 0.000 | ||
| 4 | 2009.11.04 01:52 | close | 2 | 0.97 | 90.146 | 0.000 | 0.000 | -327.11 | 9469.42 |
| 5 | 2009.11.04 06:43 | buy | 3 | 0.94 | 90.381 | 0.000 | 0.000 | ||
| 6 | 2009.11.05 01:03 | close | 3 | 0.94 | 90.602 | 0.000 | 0.000 | 230.53 | 9699.95 |
| 7 | 2009.11.05 02:28 | sell | 4 | 0.96 | 90.476 | 0.000 | 0.000 | ||
| 8 | 2009.11.05 20:47 | close | 4 | 0.96 | 90.691 | 0.000 | 0.000 | -227.59 | 9472.36 |
| 9 | 2009.11.06 00:23 | buy | 5 | 0.94 | 90.832 | 0.000 | 0.000 | ||
| 10 | 2009.11.06 02:50 | close | 5 | 0.94 | 90.625 | 0.000 | 0.000 | -214.71 | 9257.65 |
| 11 | 2009.11.06 07:06 | sell | 6 | 0.92 | 90.621 | 0.000 | 0.000 | ||
| 12 | 2009.11.06 14:26 | close | 6 | 0.92 | 90.737 | 0.000 | 0.000 | -117.61 | 9140.04 |
| 13 | 2009.11.06 14:28 | sell | 7 | 0.91 | 90.457 | 0.000 | 0.000 | ||
| 14 | 2009.11.09 20:25 | close | 7 | 0.91 | 90.089 | 0.000 | 0.000 | 371.02 | 9511.06 |
| 15 | 2009.11.09 23:00 | sell | 8 | 0.95 | 89.908 | 0.000 | 0.000 | ||
| 16 | 2009.11.12 00:08 | close | 8 | 0.95 | 89.922 | 0.000 | 0.000 | -18.45 | 9492.61 |
| 17 | 2009.11.12 14:26 | buy | 9 | 0.94 | 90.120 | 0.000 | 0.000 | ||
| 18 | 2009.11.13 01:02 | close | 9 | 0.94 | 90.266 | 0.000 | 0.000 | 152.45 | 9645.07 |
| 19 | 2009.11.13 03:05 | sell | 10 | 0.96 | 90.208 | 0.000 | 0.000 | ||
| 20 | 2009.11.17 16:47 | close | 10 | 0.96 | 89.433 | 0.000 | 0.000 | 830.43 | 10475.50 |
| 21 | 2009.11.18 04:30 | sell | 11 | 1.04 | 89.227 | 0.000 | 0.000 | ||
| 22 | 2009.11.18 17:35 | close | 11 | 1.04 | 89.390 | 0.000 | 0.000 | -189.64 | 10285.86 |
| 23 | 2009.11.18 23:00 | sell | 12 | 1.02 | 89.286 | 0.000 | 0.000 | ||
| 24 | 2009.11.20 15:02 | close | 12 | 1.02 | 89.053 | 0.000 | 0.000 | 263.73 | 10549.59 |
| 25 | 2009.11.23 00:00 | sell | 13 | 1.05 | 88.818 | 0.000 | 0.000 | ||
| 26 | 2009.11.23 02:03 | close | 13 | 1.05 | 89.000 | 0.000 | 0.000 | -214.72 | 10334.87 |
| 27 | 2009.11.23 05:23 | sell | 14 | 1.03 | 88.864 | 0.000 | 0.000 | ||
| 28 | 2009.11.27 14:19 | close | 14 | 1.03 | 86.680 | 0.000 | 0.000 | 2590.44 | 12925.31 |
| 29 | 2009.11.27 22:18 | sell | 15 | 1.29 | 86.435 | 0.000 | 0.000 | ||
| 30 | 2009.11.27 22:59 | close at stop | 15 | 1.29 | 86.482 | 0.000 | 0.000 | -70.11 | 12855.20 |